Get report samples
A valid email is required in order to receive the samples.

BLOG
Insights on 360° feedback and leadership development
A 360 degree feedback report shows how a person’s behaviors are seen by the people who work with them: their manager, peers, direct reports and others, side by side with their own self-rating. A good report doesn’t stop at averages. It shows where groups agree and disagree, where self-ratings differ from everyone else’s, what raters wrote in their own words, and how scores compare with a wider group of leaders.
Below, we walk through each section of a standard TruScore report, one screenshot at a time. The examples come from a demo report for a fictional manager at a fictional company, so no real person’s results appear. Question text is hidden in the demo because our assessment items are proprietary; in a real report you see every question in full.
Want the full report to look through on your own?
If you’re new to 360s, start with our guide to 360 degree feedback. If you already run them, the sections below show what your participants, coaches and HR team will see in a TruScore 360 assessment.
At the top of the report, you can choose to watch a short video, How to Approach Your Results. It’s worth a few minutes before you dig in. A 360 measures behaviors people can see, not personality traits, and behaviors can change. Treat the report as a snapshot of how others experience you right now, not a verdict on who you are.
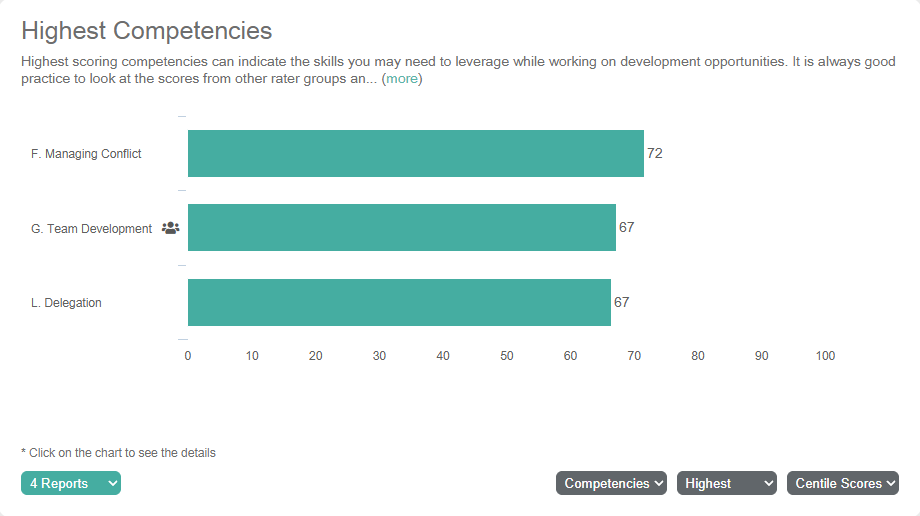
What it shows. This is the quickest summary in the report: the competencies (or individual questions) where the person scored highest, or lowest. You can switch the view by rater group, between competencies and questions, between highest and lowest, and between centile and raw scores.
How to read it. Start with the strengths. They’re the behaviors people already count on, and they’re often the best way to work on something else. Then switch to the lowest. Look for the same competency showing up across several rater groups. A low score from one group can say more about that working relationship than about the person; a low score from everyone is a clear signal.
What to do with it. Pick one or two strengths to keep using on purpose, and note any low area that appears in more than one group. That short list is the starting point for the development plan in section 8.
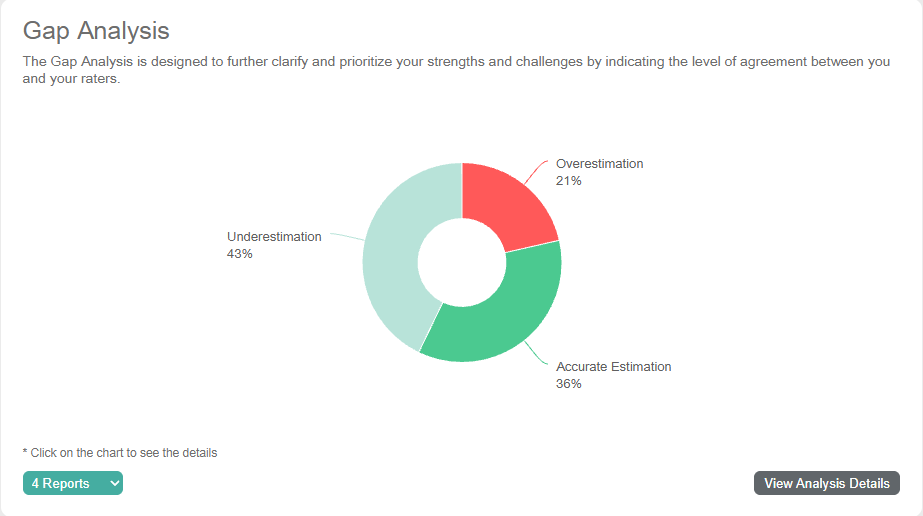
What it shows. The gap analysis compares the person’s self-rating with how others rated them, competency by competency, and sorts the results into three groups. Overestimation means the person rated themselves higher than others did. Accurate estimation means the two are close. Underestimation means others rated the person higher than they rated themselves.
How to read it. Overestimated areas are the likely blind spots: behaviors the person believes they show more often than others see. Underestimated areas are hidden strengths, things others value that the person may be underselling. A report with mostly accurate estimates usually points to someone with a realistic view of how they come across.
What to do with it. Where you rated yourself higher than others did, don’t argue with the gap. Ask what people would need to see more of. Where others rated you higher than you rated yourself, do the opposite: trust their view and use that strength more visibly.
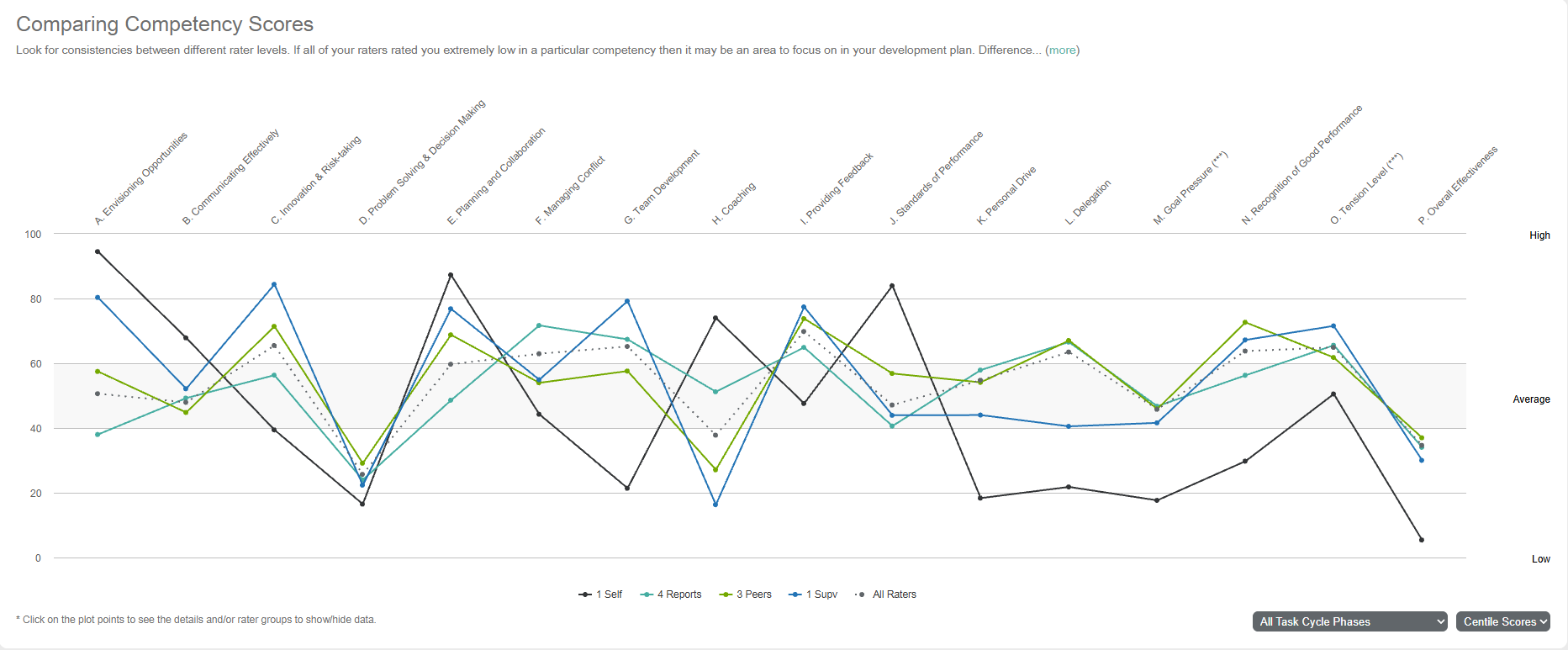
What it shows. Each competency, scored separately by each rater group, plotted on a 0 to 100 scale against low, average and high bands. In TruScore’s own assessments every rater group answers the same questions, so the comparison is like for like. To keep raters anonymous, peers and direct reports each usually need at least three responses before their scores are shown. If a group falls short, its responses can be merged into a Combined group so the report still runs. Manager scores have no minimum, since most people have only one or two managers.
How to read it. Look across each row. Agreement between groups means the behavior is consistent. Differences are where the useful questions are. A manager who rates someone highly on planning while direct reports rate them low may be seeing results, while the team sees the late nights it took to get there. Neither group is wrong; they see different parts of the job. Also note any competency marked (***). These are situational scales, where a high score isn’t always good. If they’re someone’s only strengths, it suggests pushing rather than leading. Balanced with solid leadership skills, they help.
What to do with it. Note the one or two widest gaps between groups and ask what each group sees that the other doesn’t. A coach or trusted colleague can help here, since these gaps are easy to explain away.
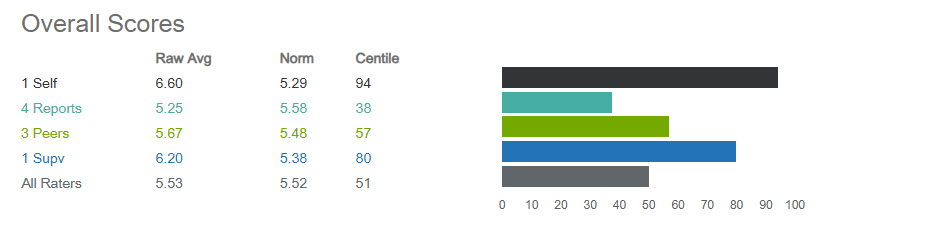
What it shows. For each rater group, three numbers: the raw average, the norm, and the centile. The raw average is the mean of that group’s ratings on the 7-point scale. The norm is the average score of a larger group of people who have taken the same survey, so you can see whether a score sits above or below the typical result. The centile shows the percentage of those people who scored lower: a centile of 30 means 30% scored lower and 70% scored higher. Above the scores, buttons open a description of the competency, what high and low scores look like, and development tips. Some organizations turn centiles off and show raw scores only (see Customizing the report below).
How to read it. Raw scores tell you how often raters see a behavior. Centiles tell you how that compares with other people. The two can tell different stories. A raw average of 5.2 might not look impressive on its own, but if most leaders score lower on that competency, the centile will show it as a strength. Raters also differ in how generous they are, so the centile helps put a score in context.
What to do with it. Use the raw scores to talk about specific behaviors and the centiles to decide where to focus. A competency with a low centile across several groups is usually a better development target than one low raw score in a single group.
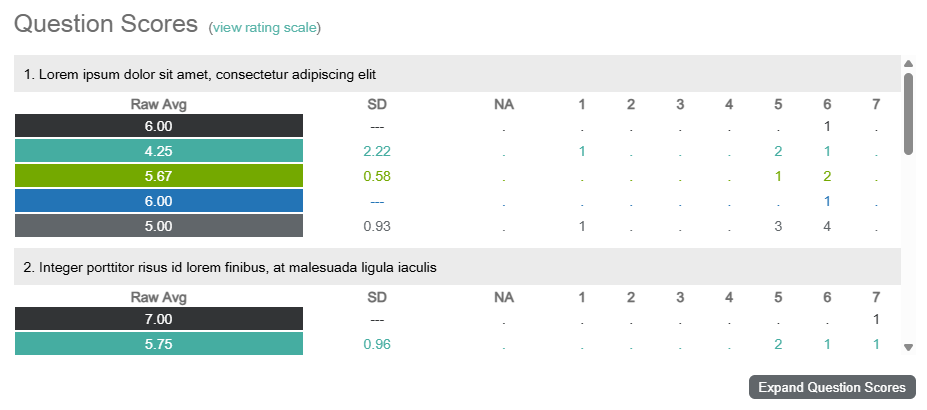
What it shows. The detail behind every competency, one question at a time. For each question you see the average, the standard deviation, how many raters answered “Not Sure” (the NA column), and how many raters chose each point on the 7-point scale, from “Never or to a very small extent” through “Average” to “Always or to a very great extent”. The demo hides the question text; a real report shows it.
How to read it. The spread matters as much as the average. A low standard deviation means raters mostly agree. A high one, 1.5 or more, means people see the behavior very differently, often because they work with the person in different ways, such as peers versus direct reports or onsite versus remote. The distribution shows how they differ: two raters at the bottom of the scale can pull down an average that everyone else rated well. A high Not Sure count means raters haven’t had much chance to see that behavior, which is worth knowing in itself.
What to do with it. Turn a broad competency into something specific. A broad competency is hard to work on; the question behind the low score usually names the exact behavior to change. For more on what good 360 questions look like, see our guide to 360 feedback questions.

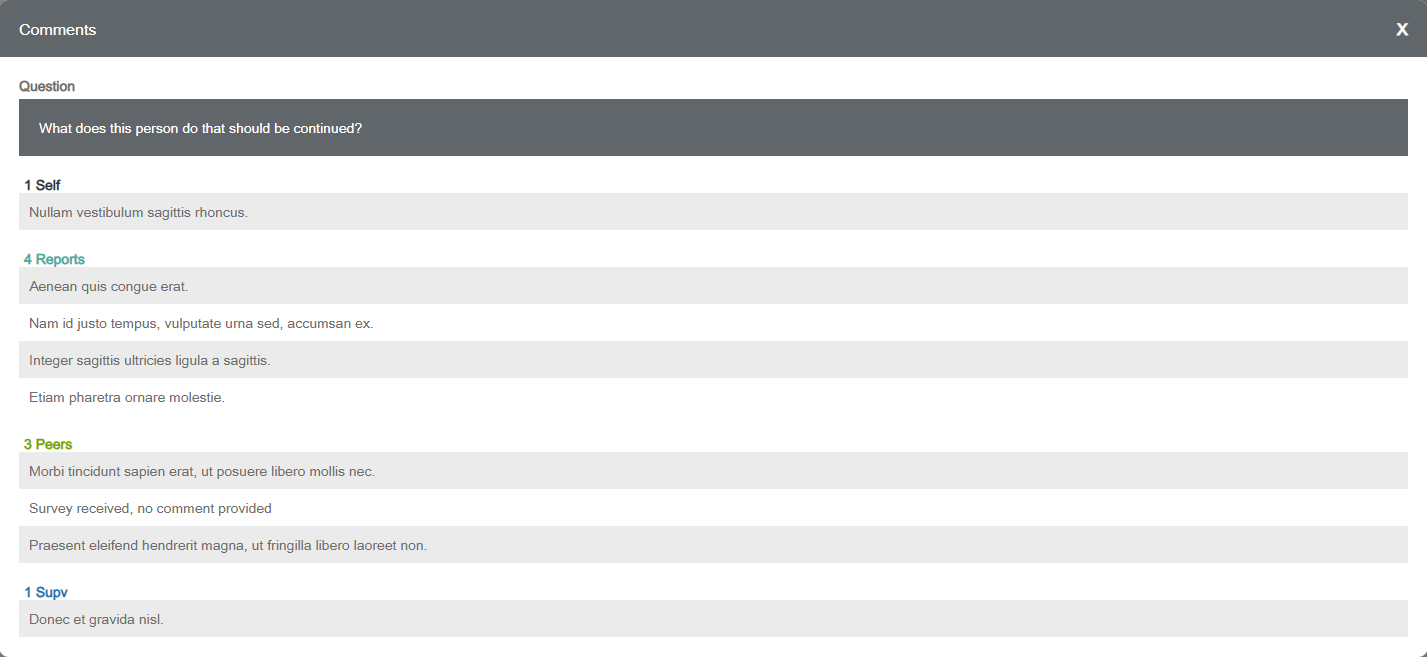
What it shows. Raters’ written answers to three open-ended prompts: what the person does that should be continued, what they should do to be more effective, and what they do that should be stopped. Answers are grouped by rater group. Comments appear exactly as raters typed them, and their order is randomized within each group so no one can match a comment to a person by where it falls in the list.
How to read it. Comments explain the numbers. Read them after the scores, and look for themes that repeat across several raters rather than reacting to the single sharpest remark. One blunt comment is one person’s view; the same point made five ways is a pattern.
What to do with it. Write down the two or three themes that come up most, in your own words, and connect each to a score from earlier sections. That gives you evidence for a goal, not just a feeling about it.
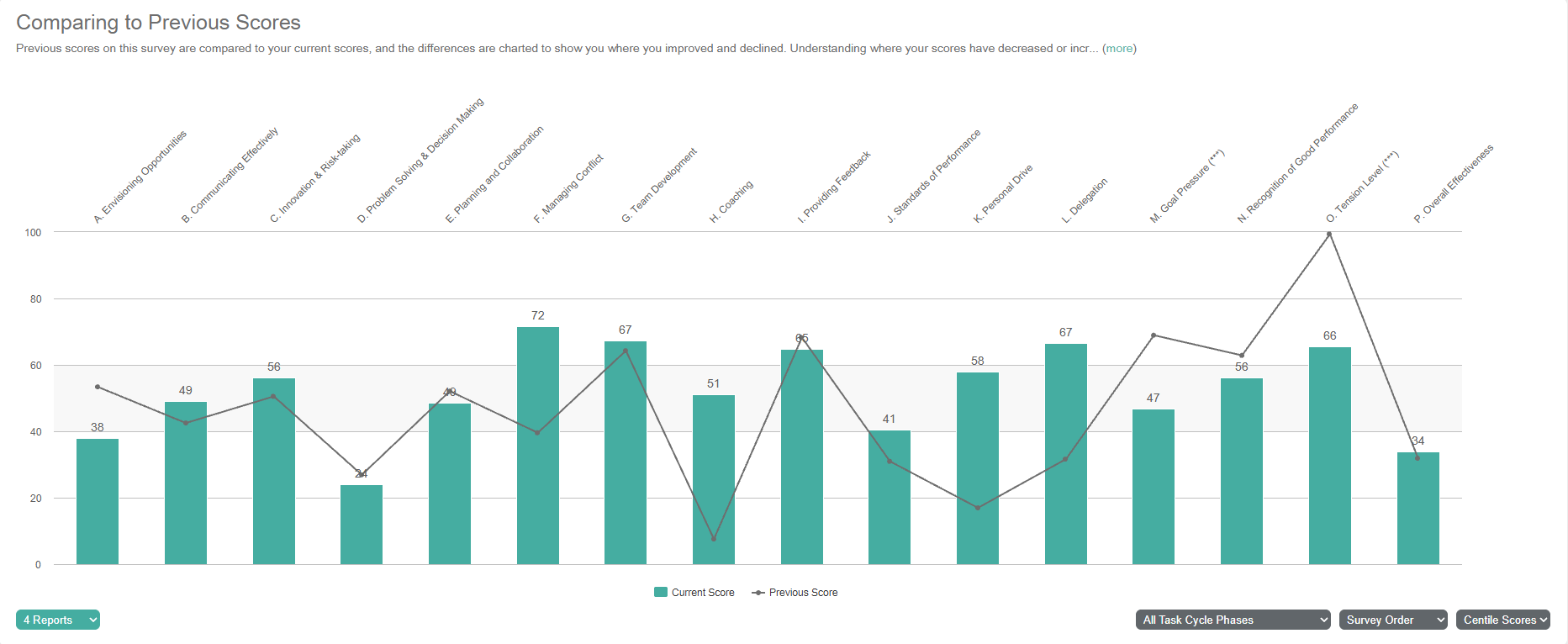
What it shows. When someone has taken the same assessment before, the Previous Scores tab charts each competency’s current score as a bar, with the earlier score as a line across it, so you can see what moved.
How to read it. Look first at the areas the person chose to work on last time. Did others notice a change? Then look for movement elsewhere, up or down, since a new role, team or set of raters can shift scores too. Small changes in one group matter less than a consistent shift across several.
What to do with it. Credit the progress, then reset the plan. We recommend reassessing every 12 to 18 months, which gives new habits enough time to show up in how others rate you.
The example above shows TruScore’s standard report. Organizations that run their own custom assessments on our platform can have the report template adjusted to fit their program, including what’s shown, how scores are presented, branding, and the development content tied to each competency. For example, some organizations turn centiles off and show raw scores only. If your assessment needs something different, we’ll work with you to set the report up the way your participants need it.
A report only helps if it leads to a change people can see. That’s why the conversation after the report matters as much as the report itself.
Reading a 360 on your own is hard. Feedback can feel personal, one sharp comment can crowd out everything else, and it’s easy to explain away a gap you don’t like. The best way to work through your results is with a certified coach. A coach acts as a thought partner, helping you see the feedback in the context of your role and your organization instead of through the emotional noise of the first read.
A TruScore coaching debrief follows a clear path. Before the session, the coach reviews your report, looking for patterns across rater groups and gaps between your self-ratings and others’ ratings. In a confidential debrief, they help you separate meaningful patterns from one-off comments. Then, together, you choose one to three behaviors that will make the biggest difference.
Coaching can be one-to-one, in person or virtual, or a group debrief where several leaders work through their results together. Organizations that want to run debriefs themselves can use our train-the-trainer program to prepare their own talent professionals. Wondering whether to look at your results first? See should you read your 360 report alone or with a coach?
Bring together what the earlier sections told you: the strengths from section 1, the blind spots from section 2, the widest group differences from section 3, and the themes from the comments. For each behavior you choose, write down what you’ll do differently, who will notice, and how you’ll know it’s working.
TruScore’s interactive development planning tool turns those choices into a plan with specific actions and timelines. You can track progress over time and share goals with your manager or coach, so the plan doesn’t sit in a drawer. The micro-learning in the report helps too: development tips, examples of what high and low scores look like, and short development videos for each competency.
Plans fade without follow-up. Thank your raters and tell them what you’re working on. It shows the feedback was heard and gives people a reason to notice the change. Regular check-ins with your coach or manager keep the work moving, a short pulse check a few months in can show whether new behaviors are taking hold, and a reassessment after 12 to 18 months measures real progress. Our five-step framework for the first 30 days explains why the first month matters most.
Learn more about 360 feedback coaching and development tools.
This walkthrough covers the main views. To explore the complete demo report yourself, request the samples and we’ll email them to you.
A typical 360 degree feedback report includes scores for each competency by rater group, a comparison of self-ratings with others’ ratings, results for each question, written comments, and comparisons with a norm group. Many also show change since an earlier assessment. A TruScore report covers all of these, as the sections above show.
Comments are grouped by rater group, not by name, and their order is randomized within each group. Peer and direct report groups usually need at least three responses before their scores and comments appear, and a smaller group can be merged into a Combined group so no single rater can be picked out. Manager feedback is the exception. Most people have only one or two managers, so their feedback isn’t anonymous in the same way.
A raw score is the average rating on the 7-point scale, so it tells you how often raters see a behavior. A centile compares that score with others who have taken the same survey, so it tells you how the score stacks up: a centile of 30 means 30% scored lower and 70% scored higher. Use raw scores to talk about behaviors and centiles to choose priorities.